403 Huron Apt C
This chart shows solar production in five-minute increments throughout the day.
Data Source
![]()
Data back until June 16, 2011
This chart shows solar production during the given year. The line chart has daily generation totals and the bar chart has monthly generation totals.
Data Source
![]()
Data back until June 16, 2011
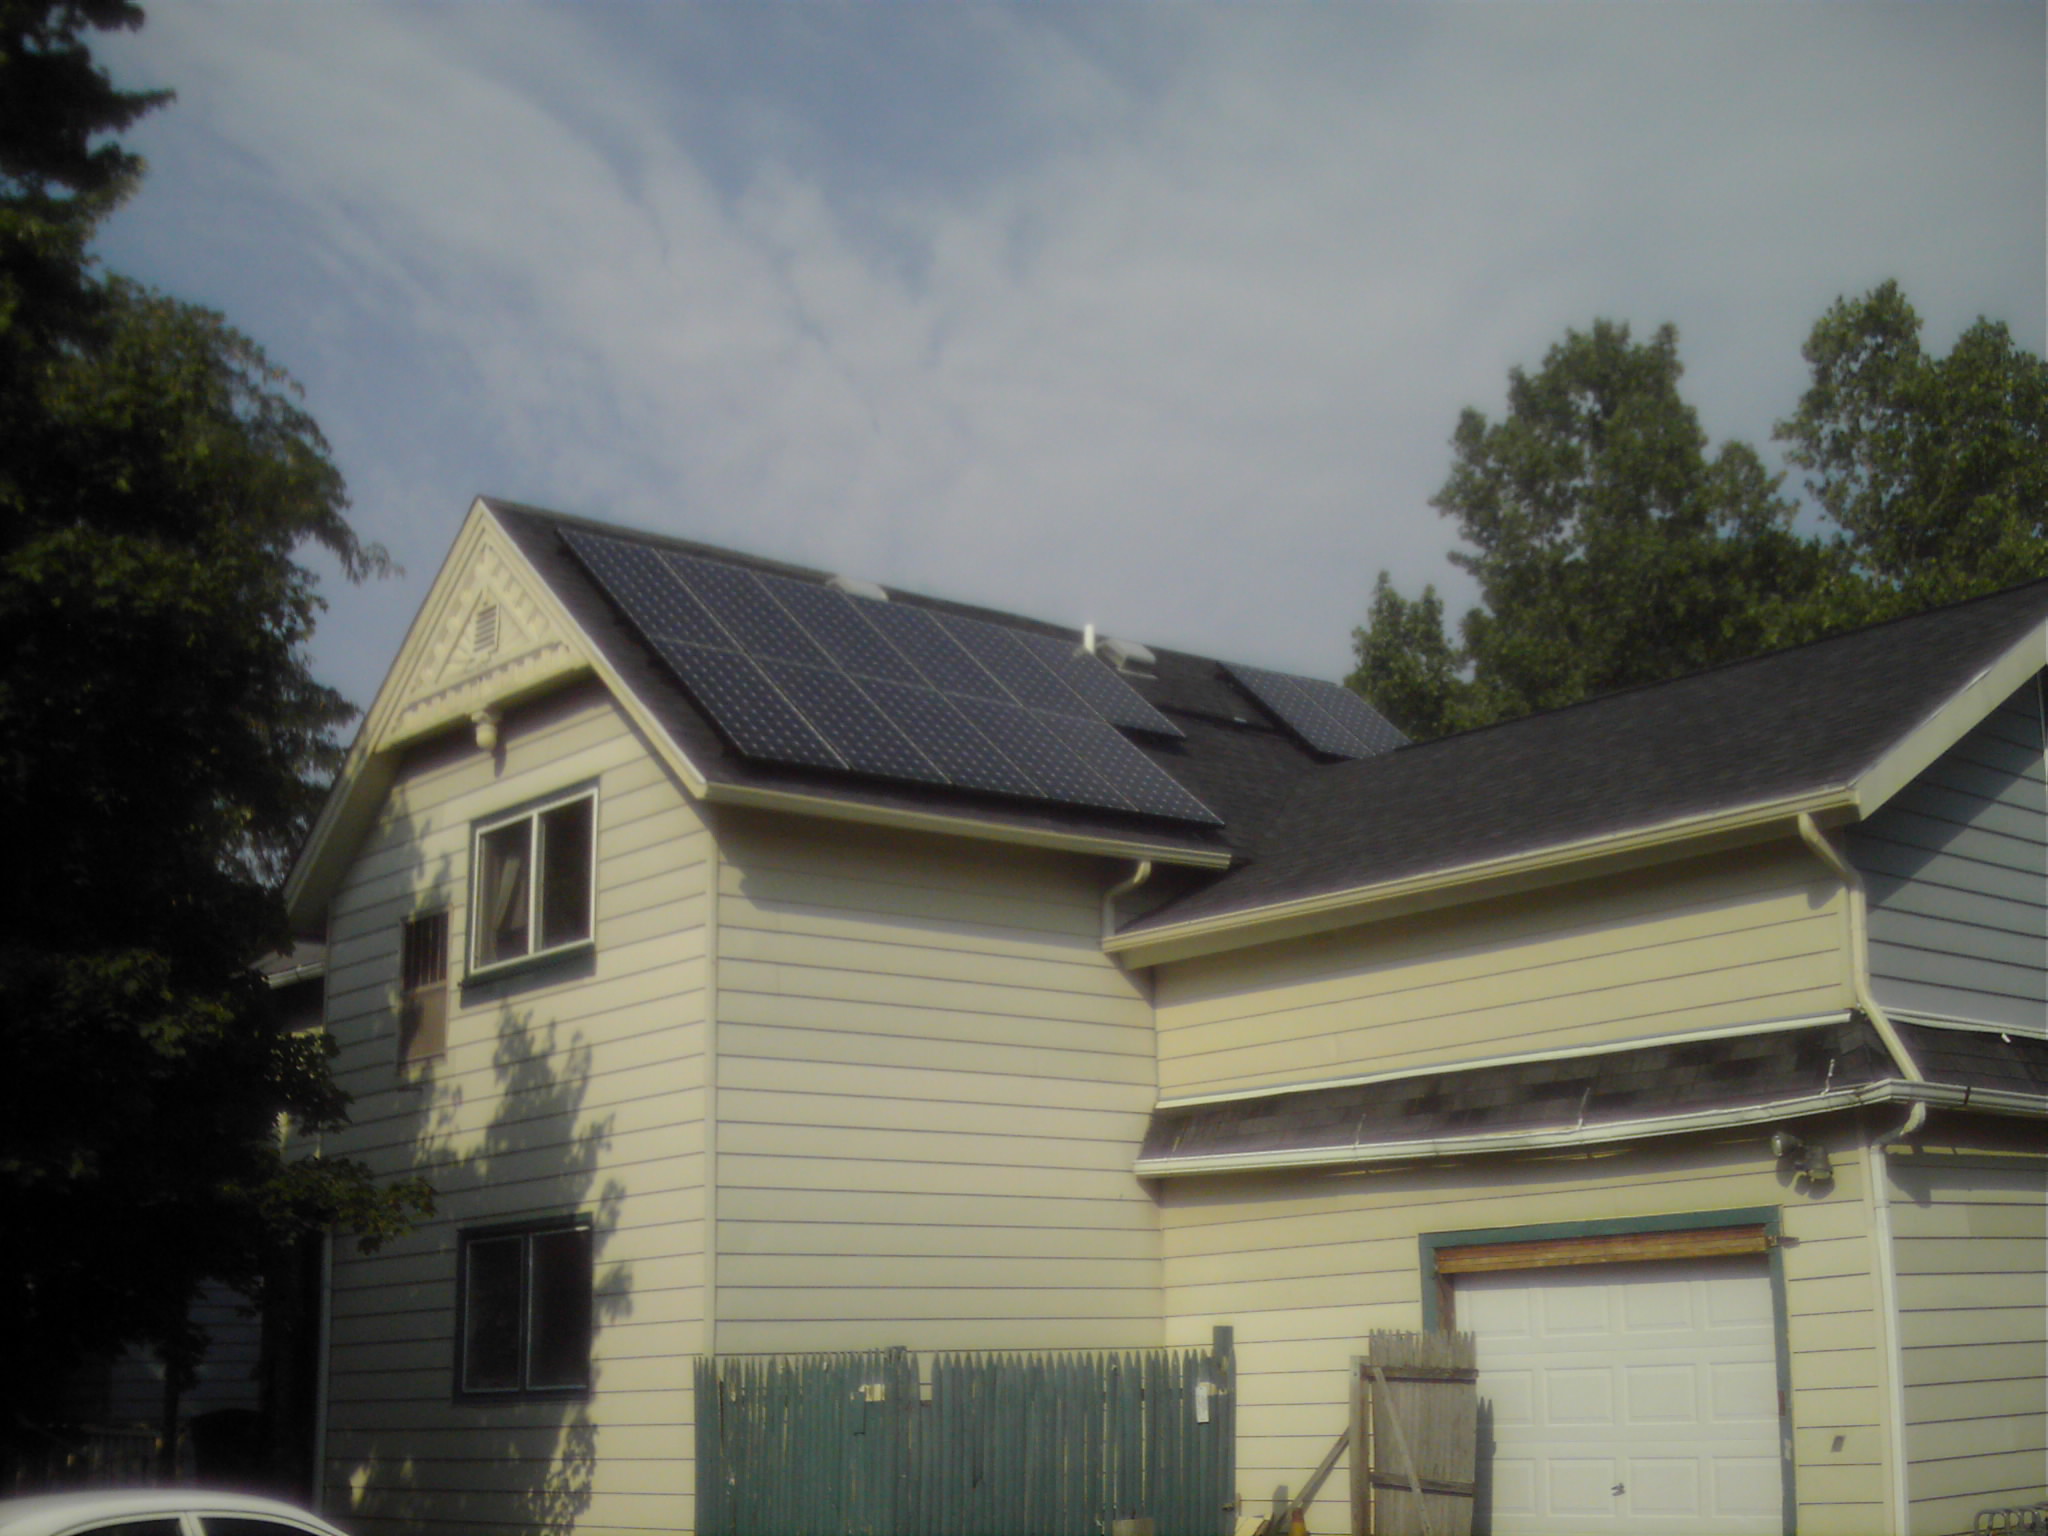
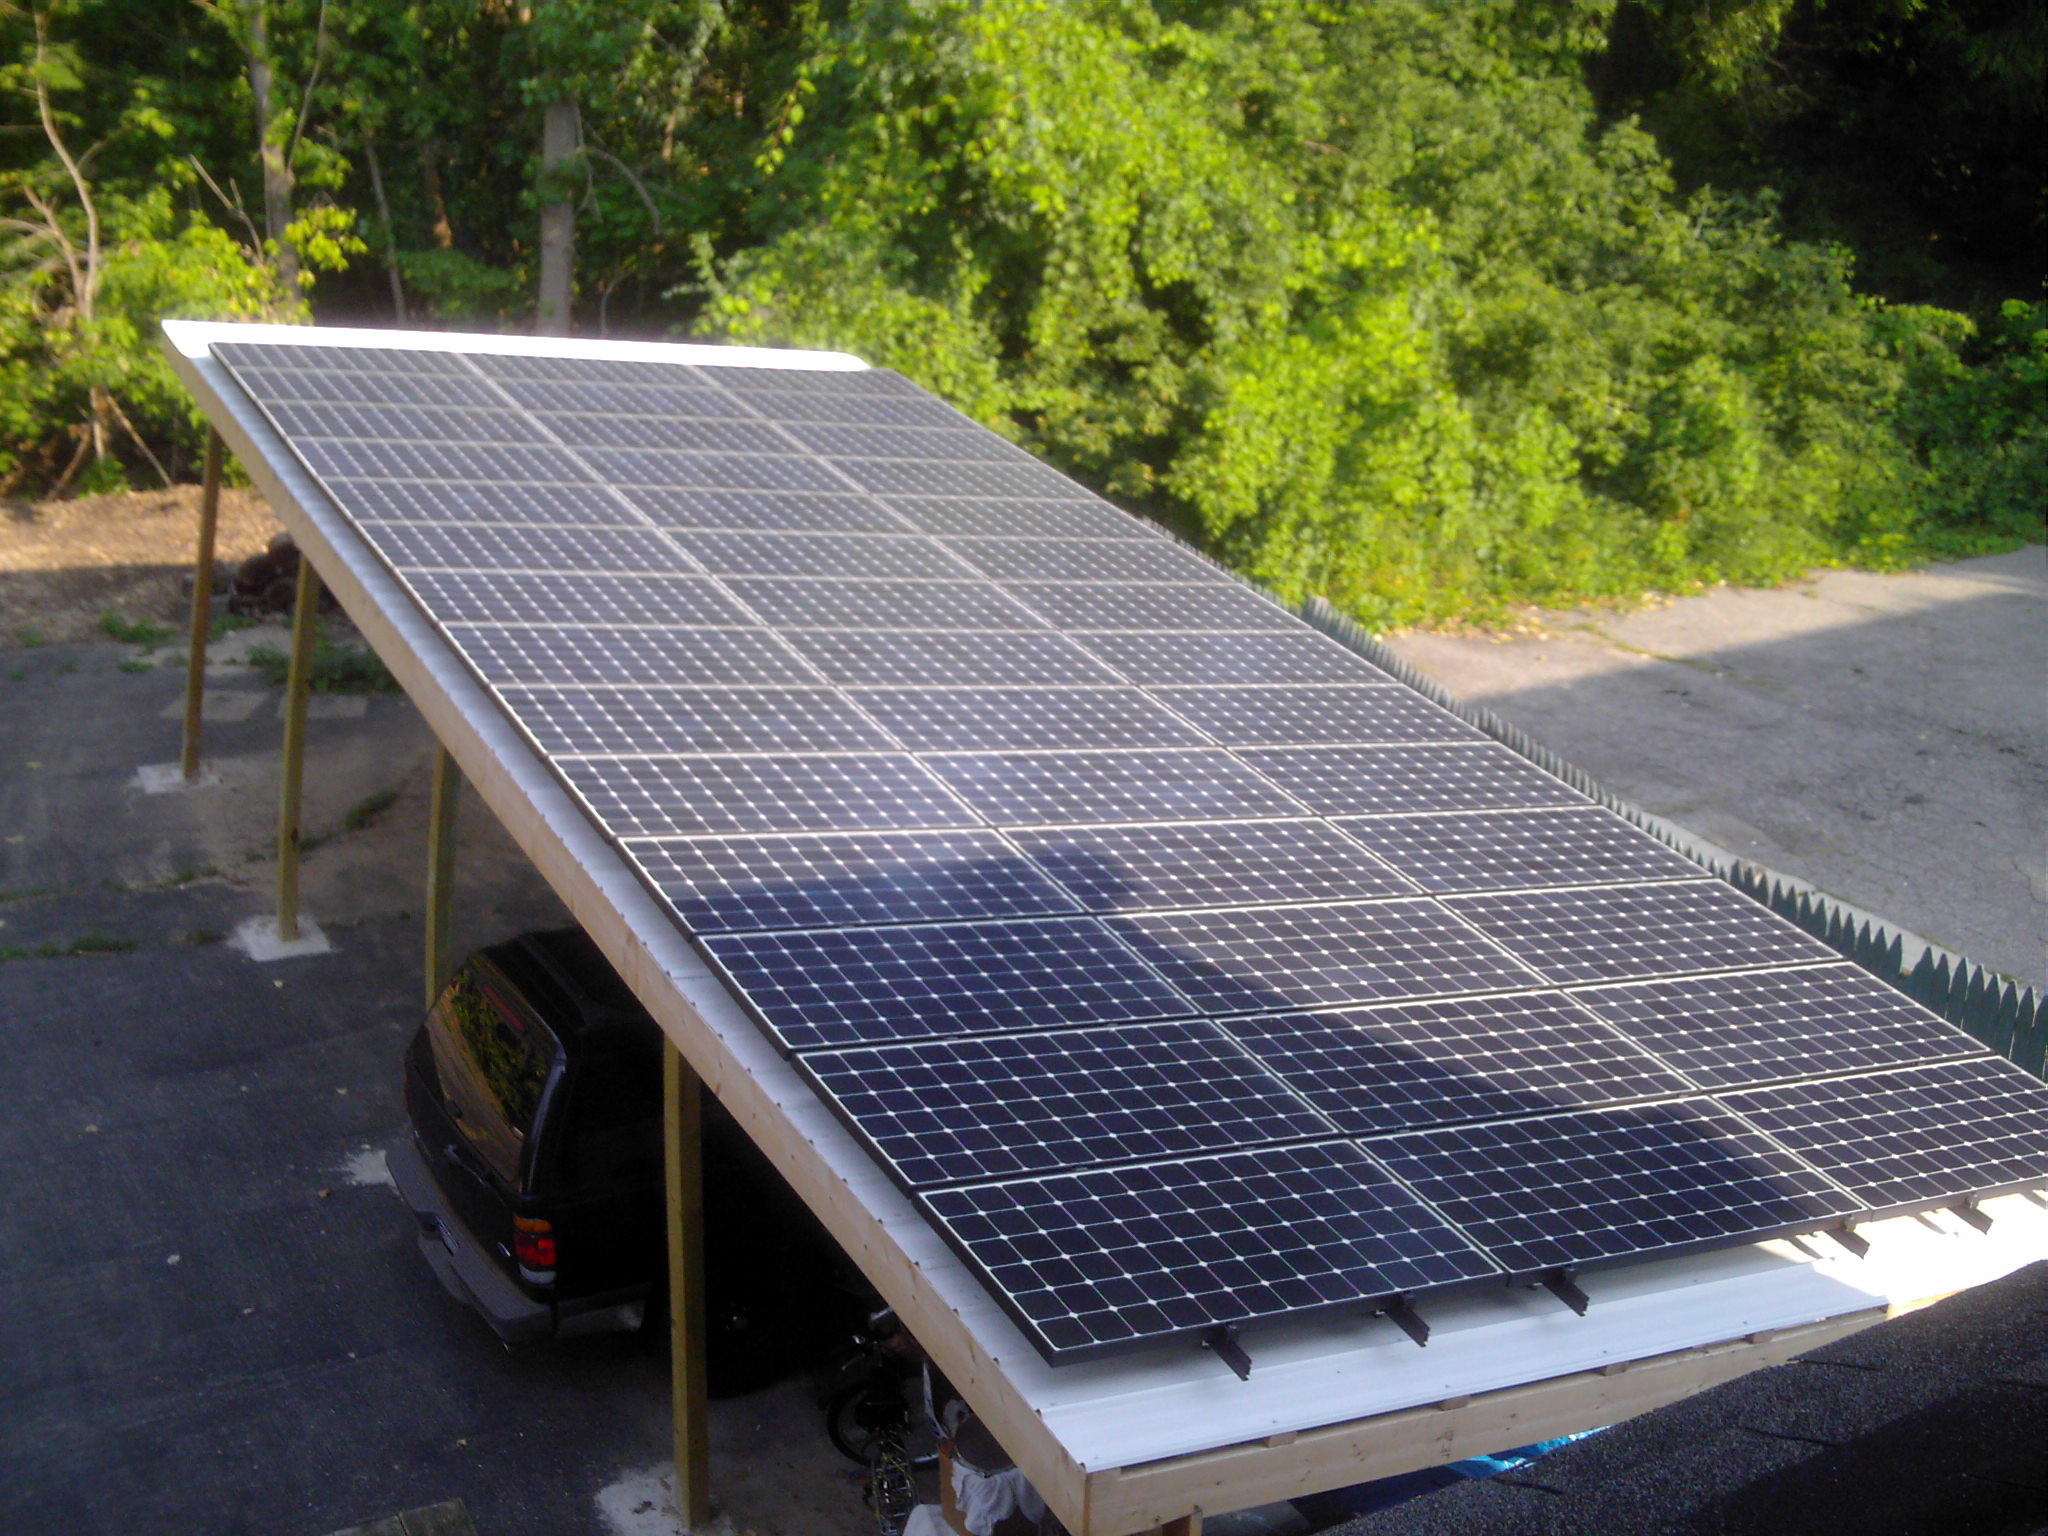
Installation Specifics
- Installation Type
- Private
- Installation Completed
- August 2011
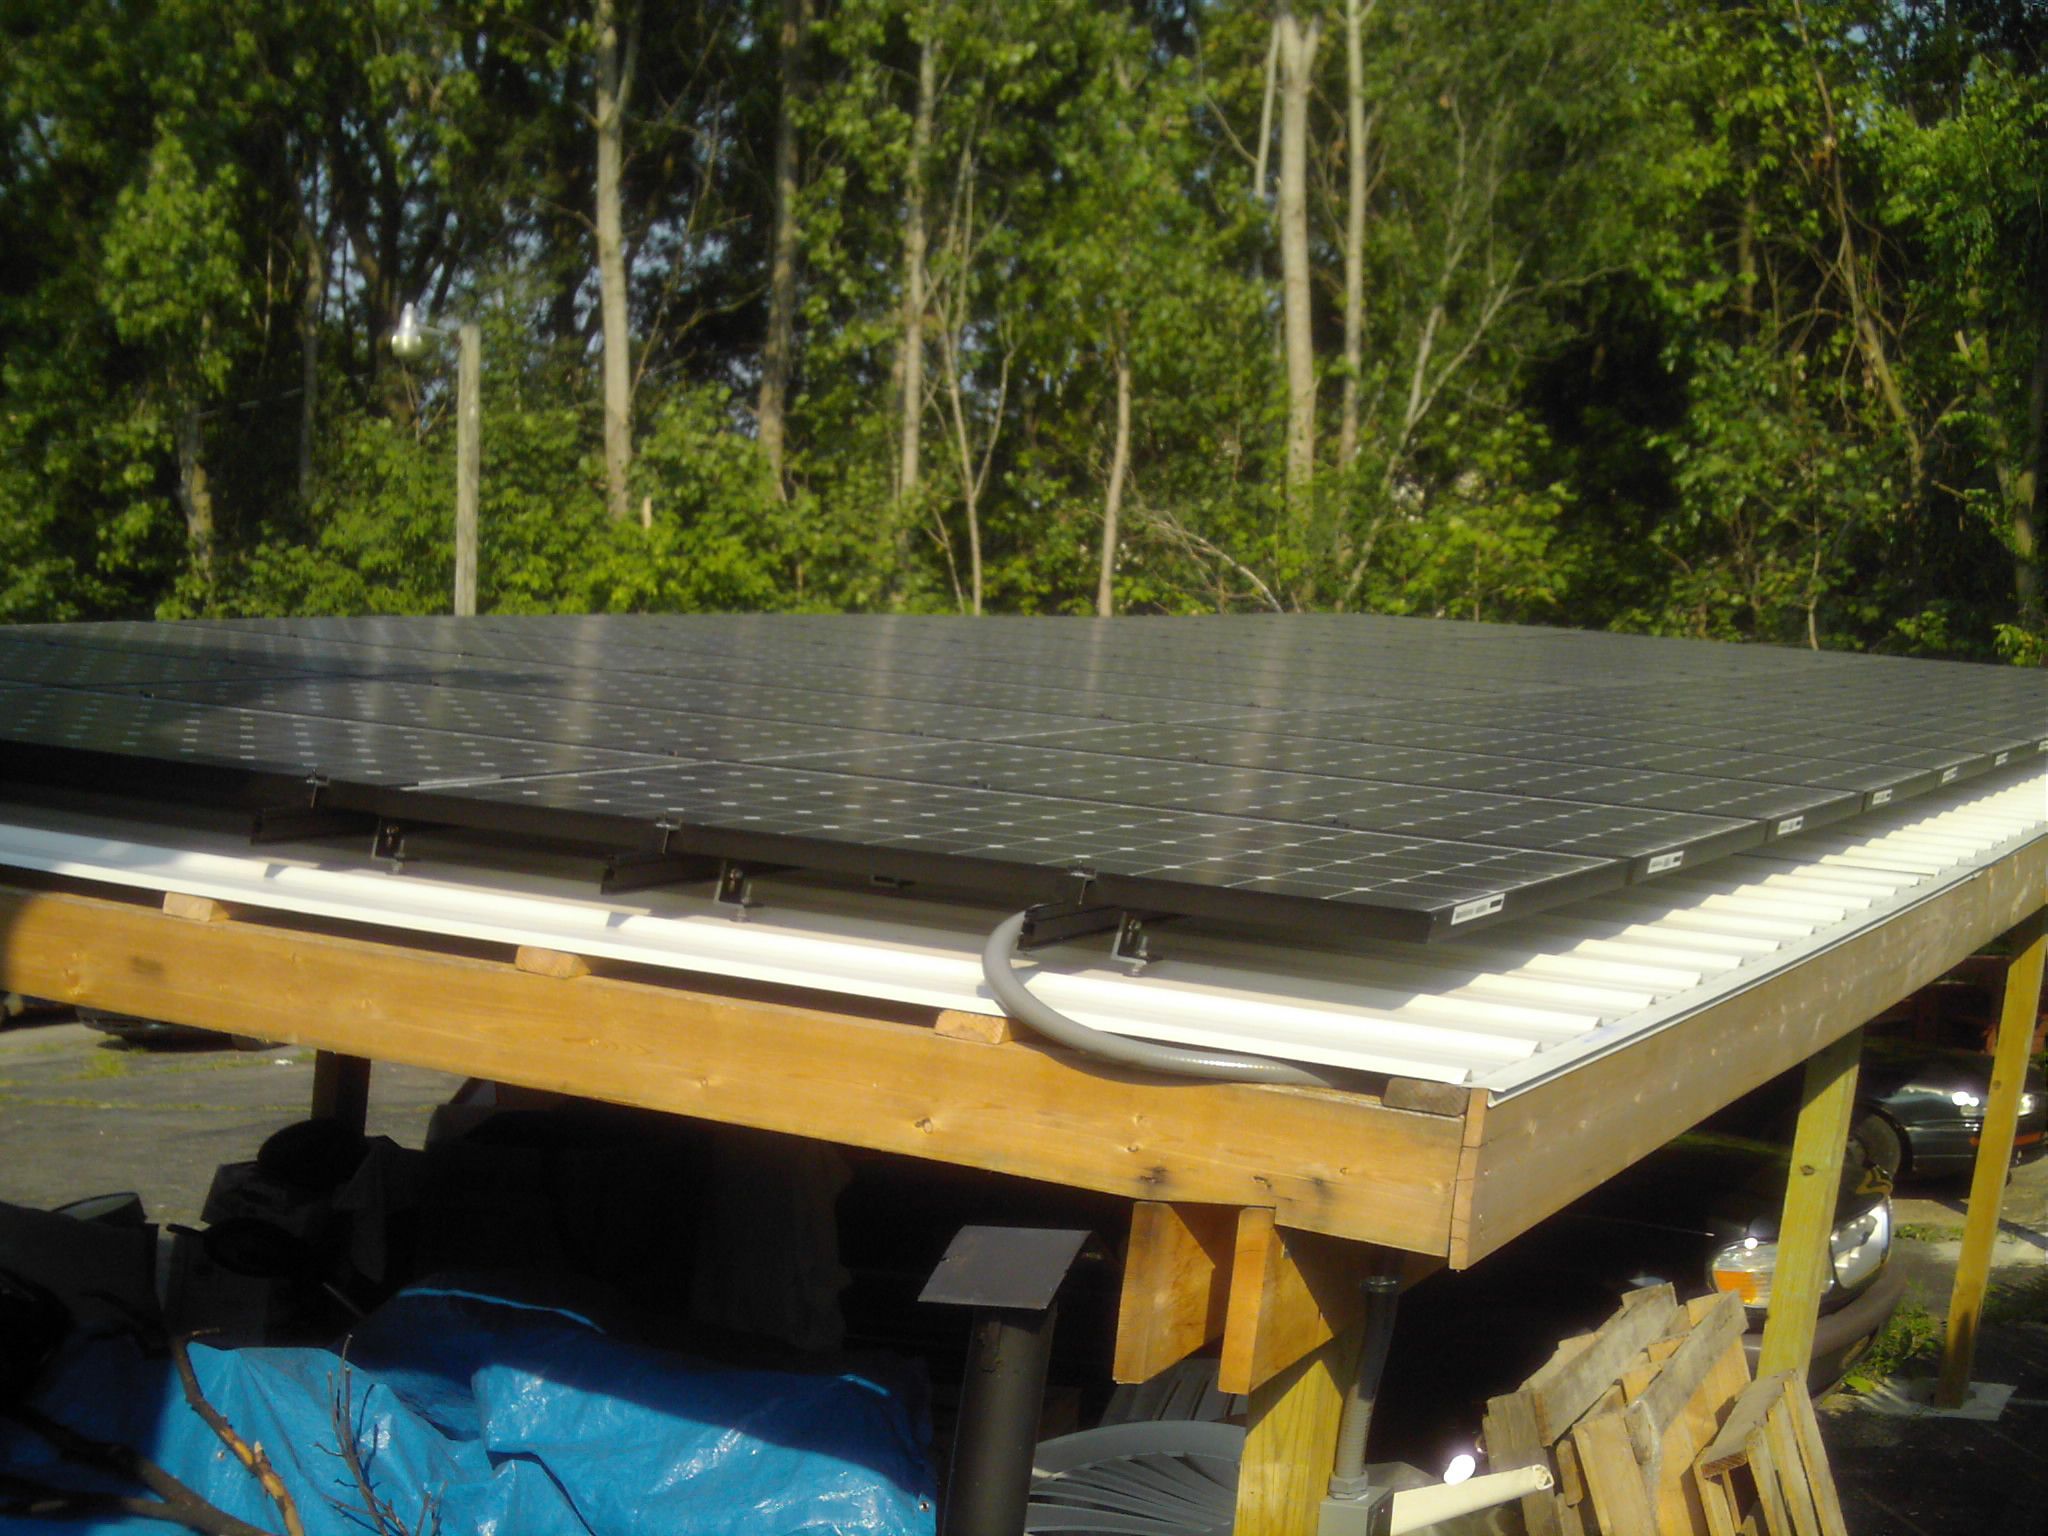
- Number/Type of Panels
- 40 SunPower 238 watt
- Install Specs
- 13 panels at 45° and 27 panels at 10° all facing South
- Size/Type of Inverter
- 40 Enphase M215 MicroInverters
- Installer
- Oak Electric
- Rated Output
- 9520 W
- Contact
- Kevin Krzyzanski
Images
Click on an image for a larger view
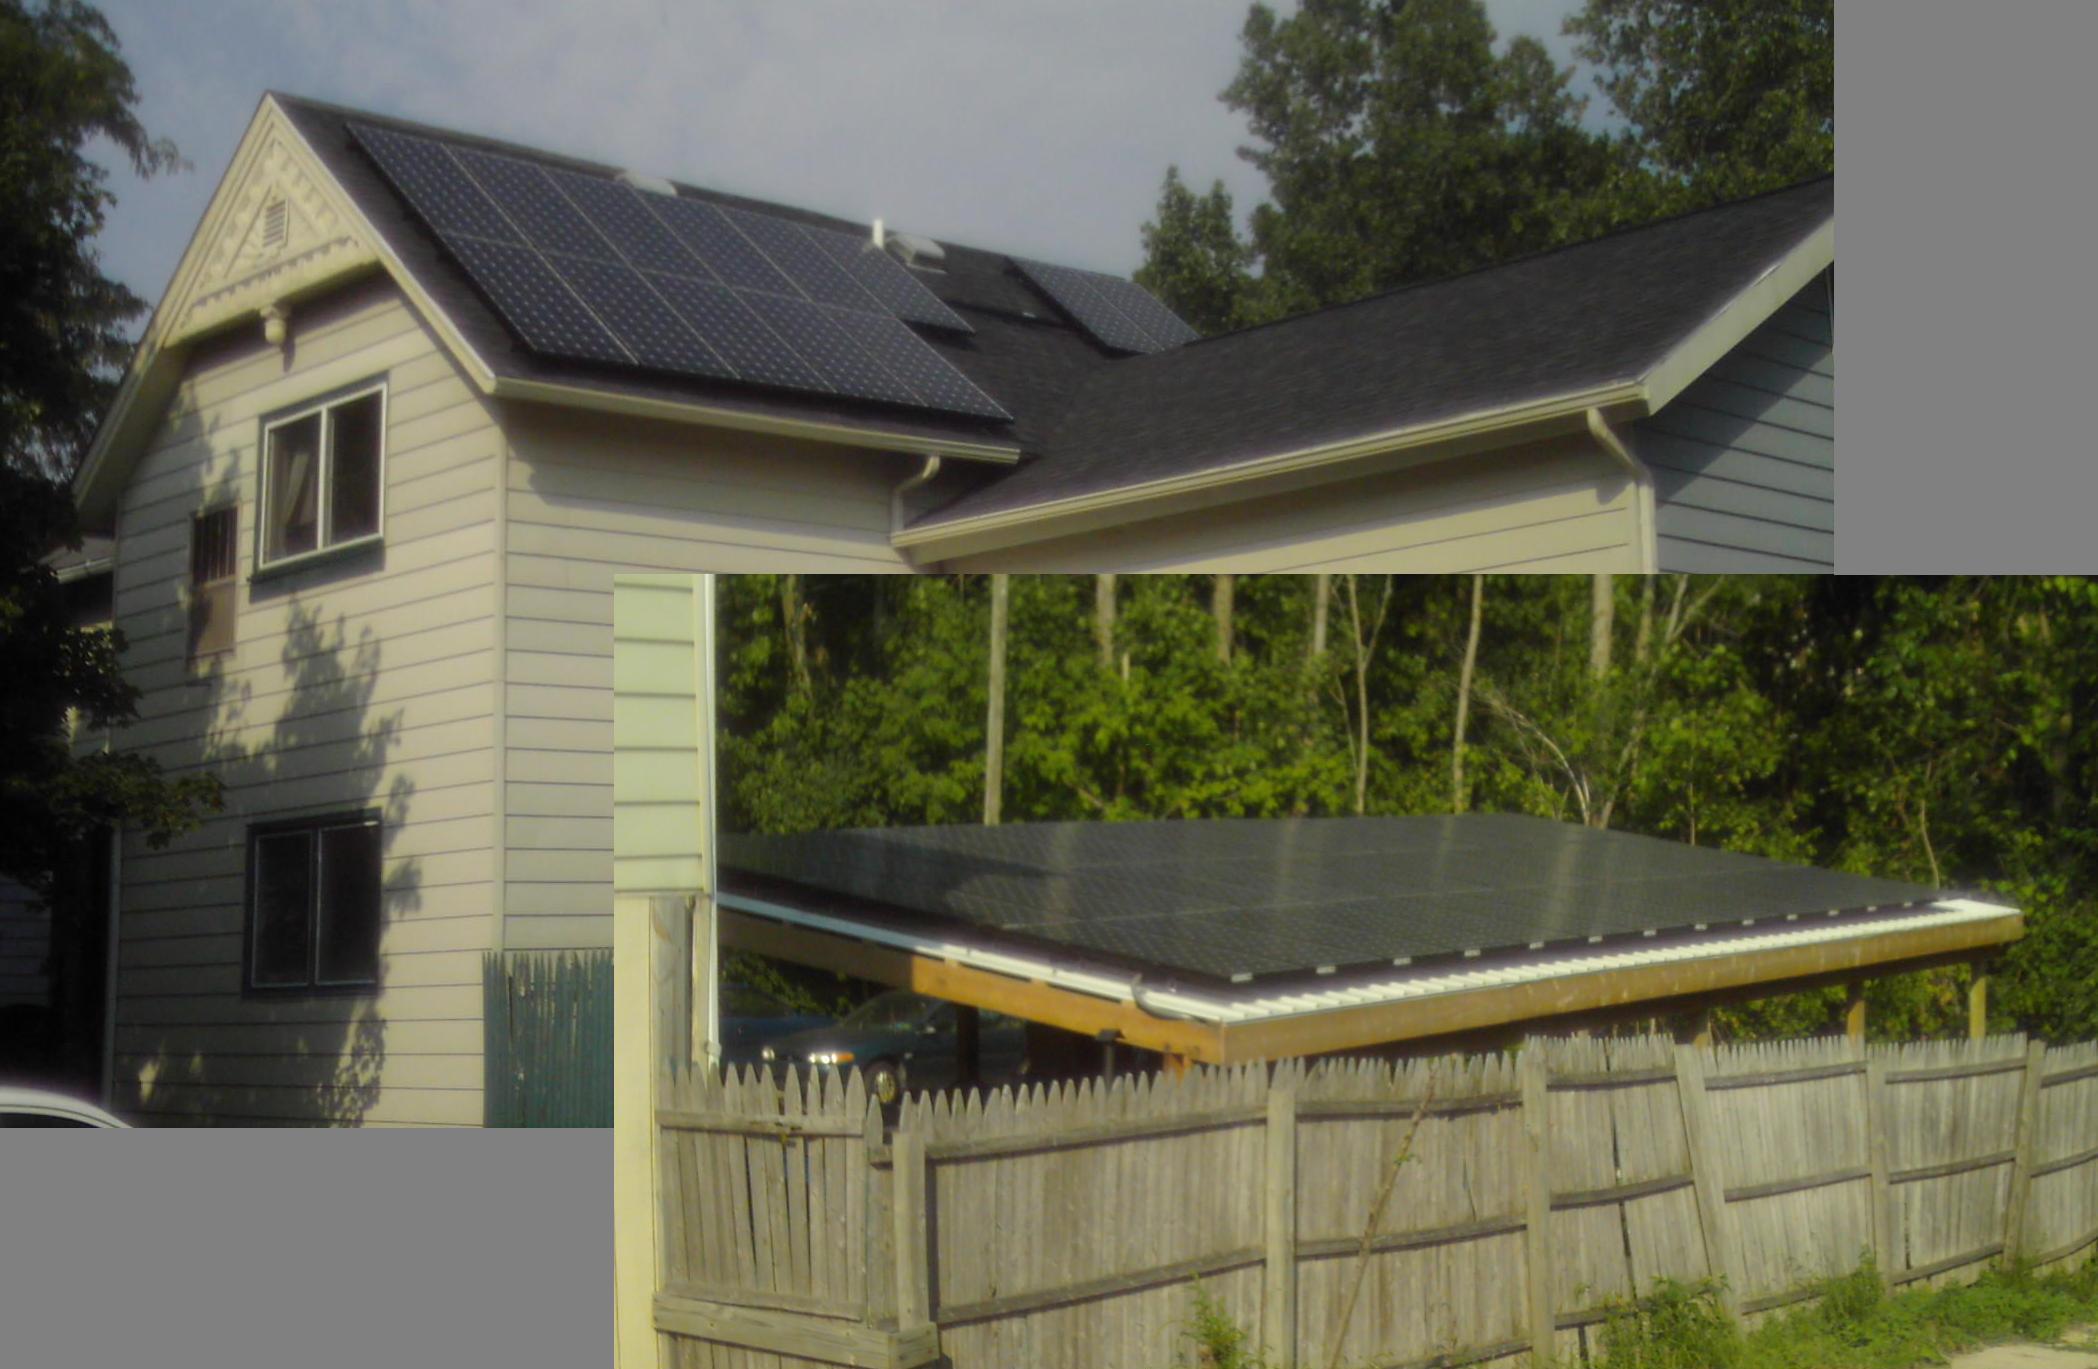
403 Huron Solar Panels
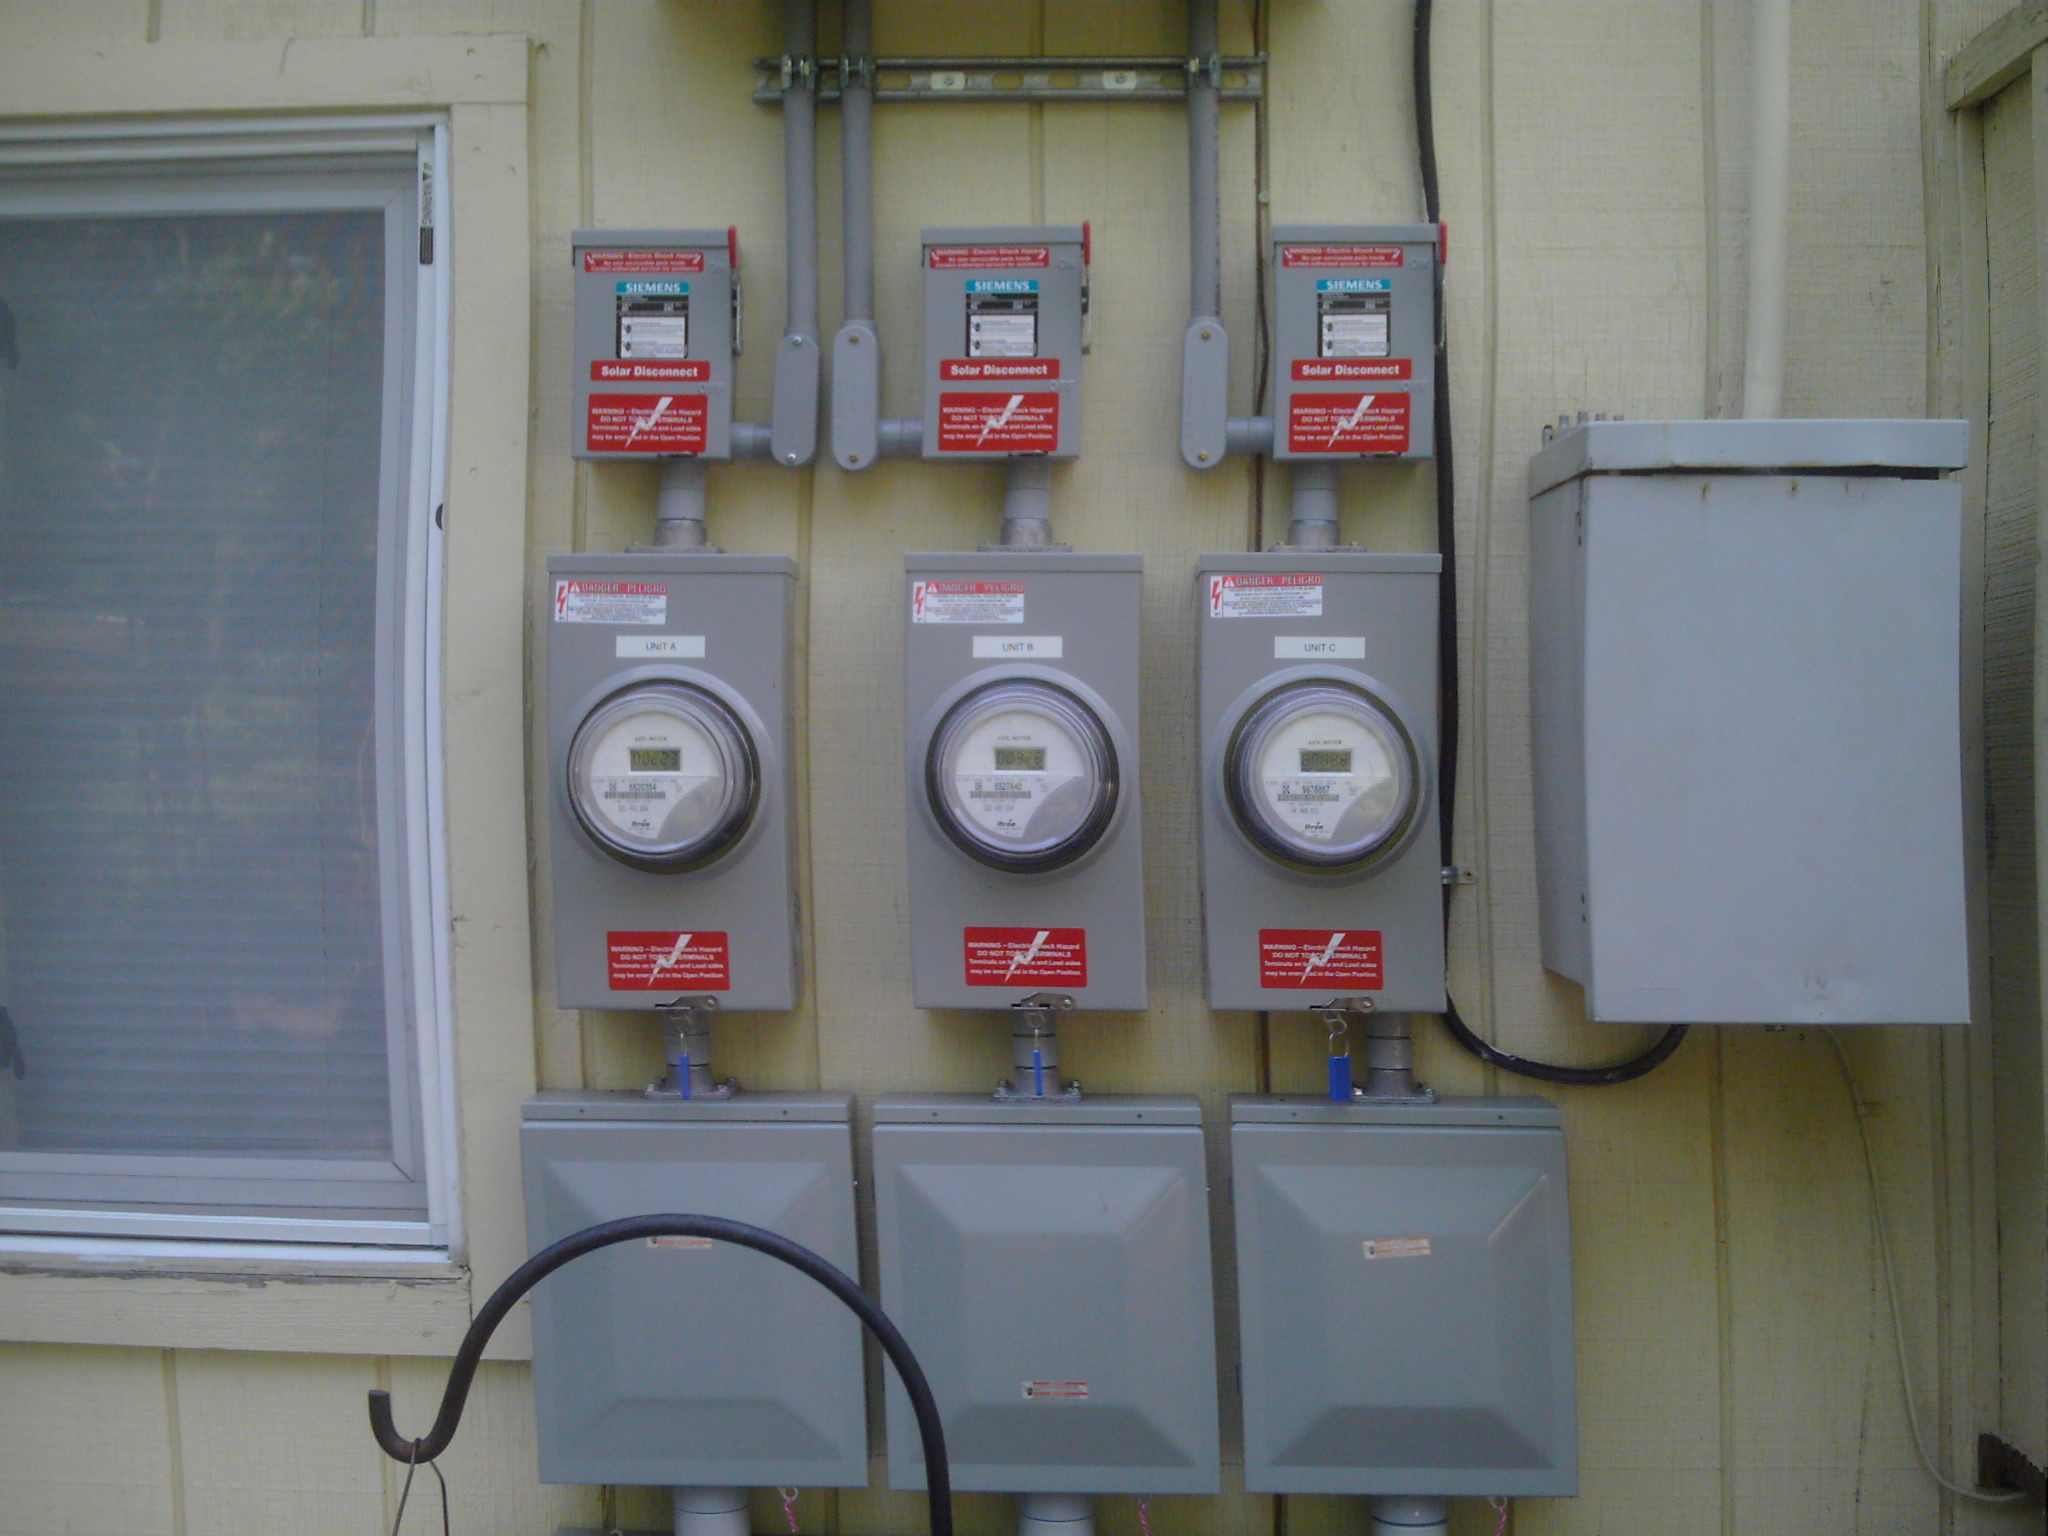
Electrical Meters

Electrical Meters
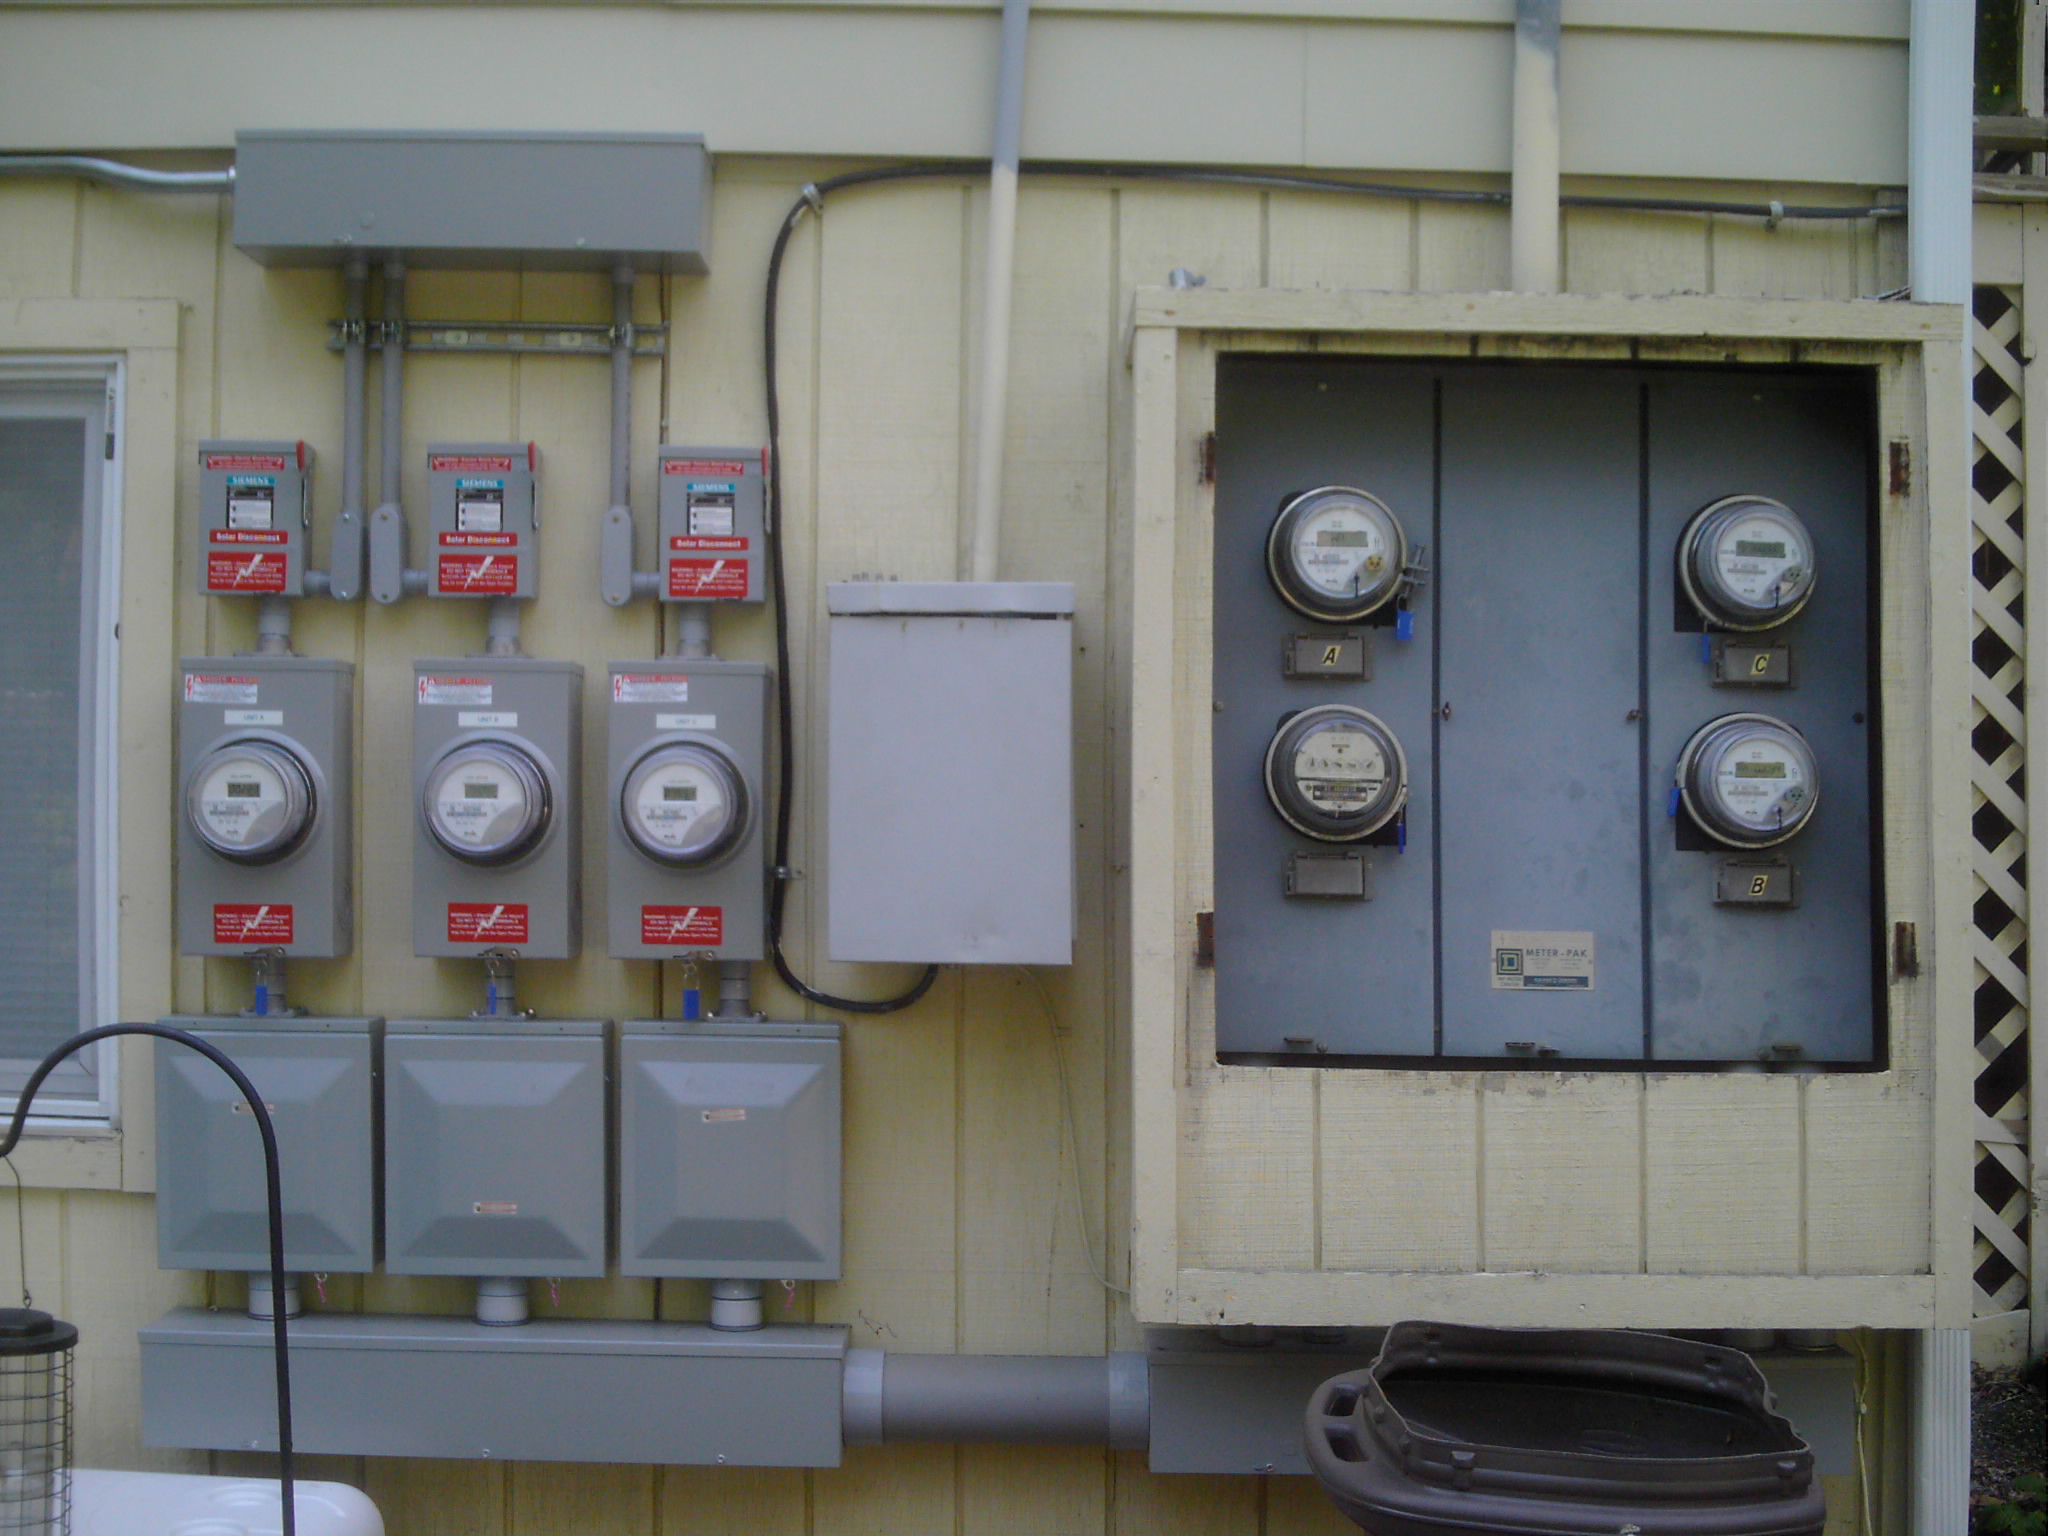
Electrical Meters
403 Huron Solar Panels

403 Huron Solar Panels
403 Huron Solar Panels

403 Huron Solar Panels

403 Huron Solar Panels
403 Huron Solar Panels